

What Are Trend Lines In Trading?

A trend line is a diagonal line on a price chart and can be used to show the general direction of the market, help identify changing trends, and help to make trading decisions.
There are three main types of trend lines we use in the Duomo Method: baselines, which are the strongest and rarely broken; standard lines, showing smaller trends within the main trend; and micro lines, which capture smaller fluctuations.
What is a Trend Line?
Simply put, trend lines are diagonal lines we can draw on the chart which map the highs and lows of a wave.
Price charts don’t just show the price moving up and down, they also separate these movements into periods of time, which we can see as candles. This gives the price a sort of zigzagging pattern as price moves up and down, and the chart scrolls along with time.
However, these movements often follow an overall direction, which we call a “trend.” A trend line will often map the outline of this trend, such as a series of higher highs or lower lows. Although, that’s not always the case.
They’re a form of “invisible” significant level, meaning they aren’t explicit price levels like horizontal lines, they are diagonal and move through a range of prices.
For example:
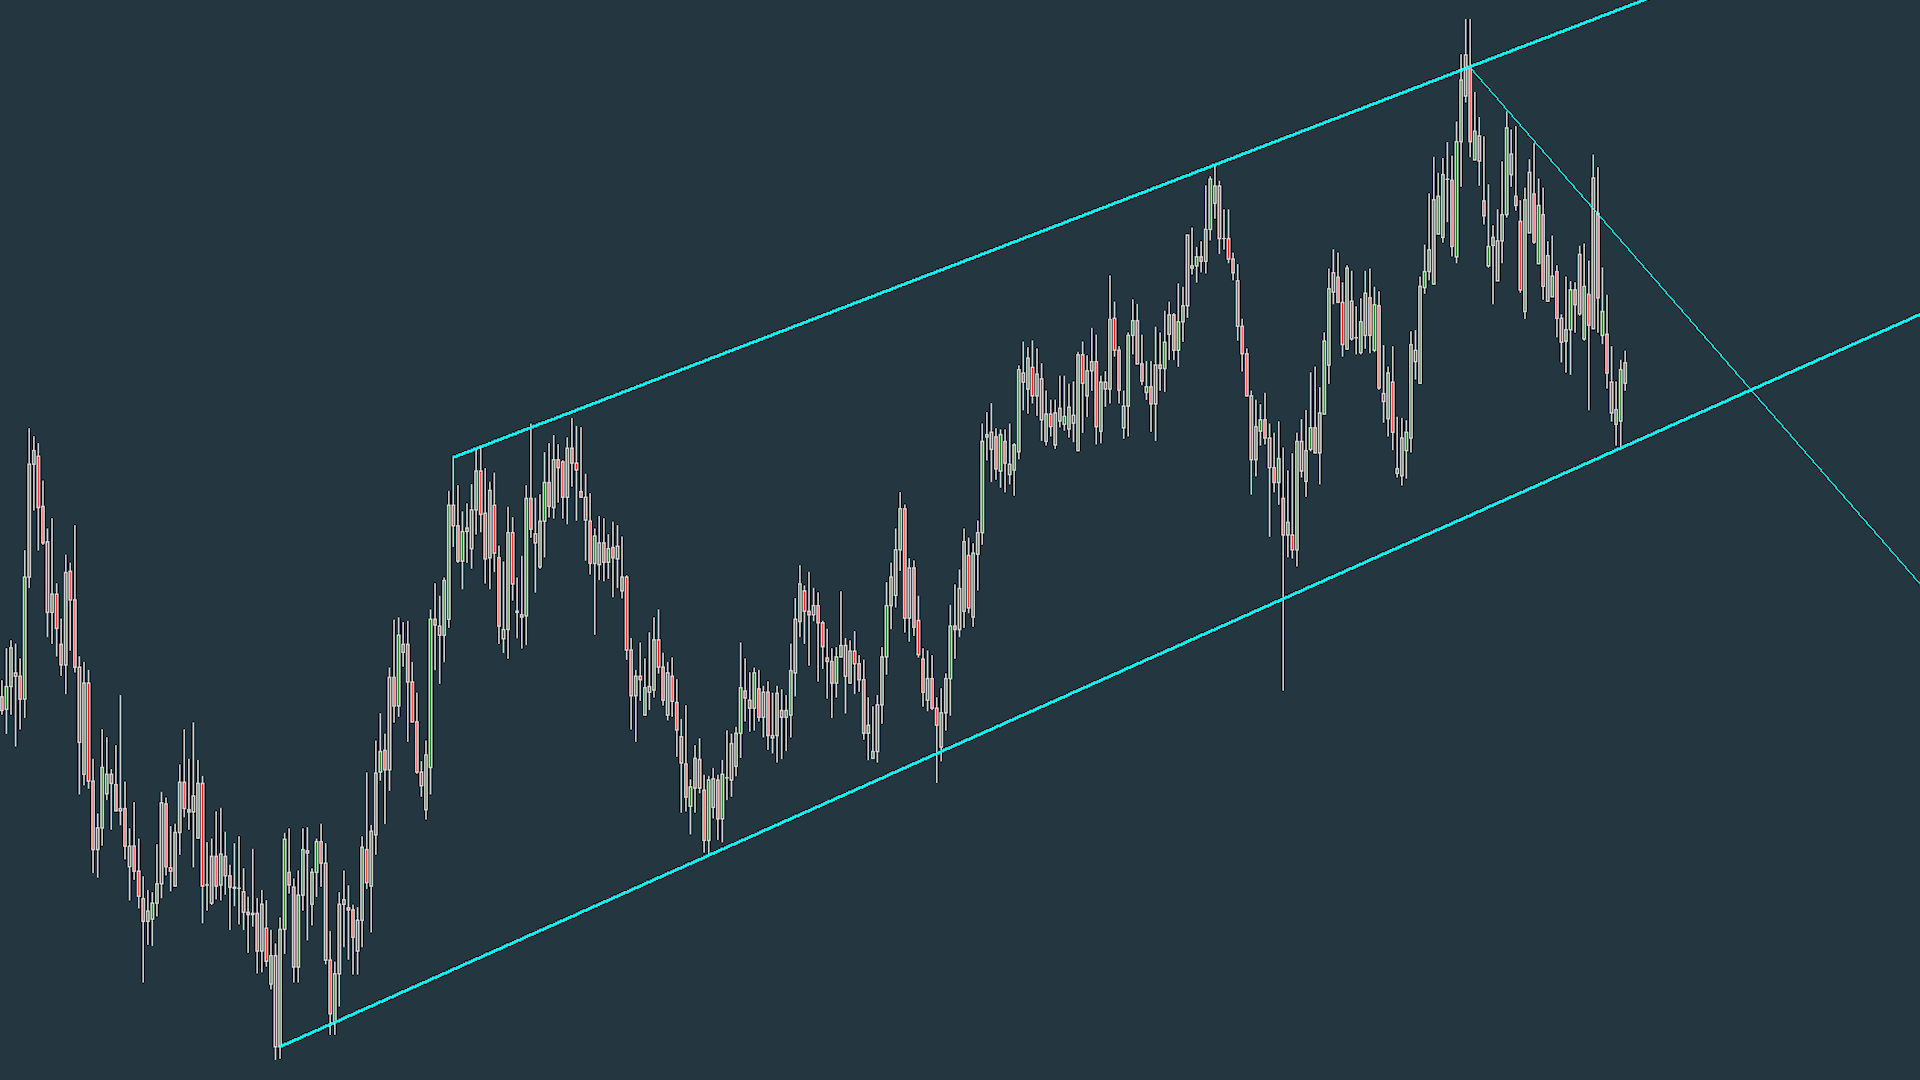
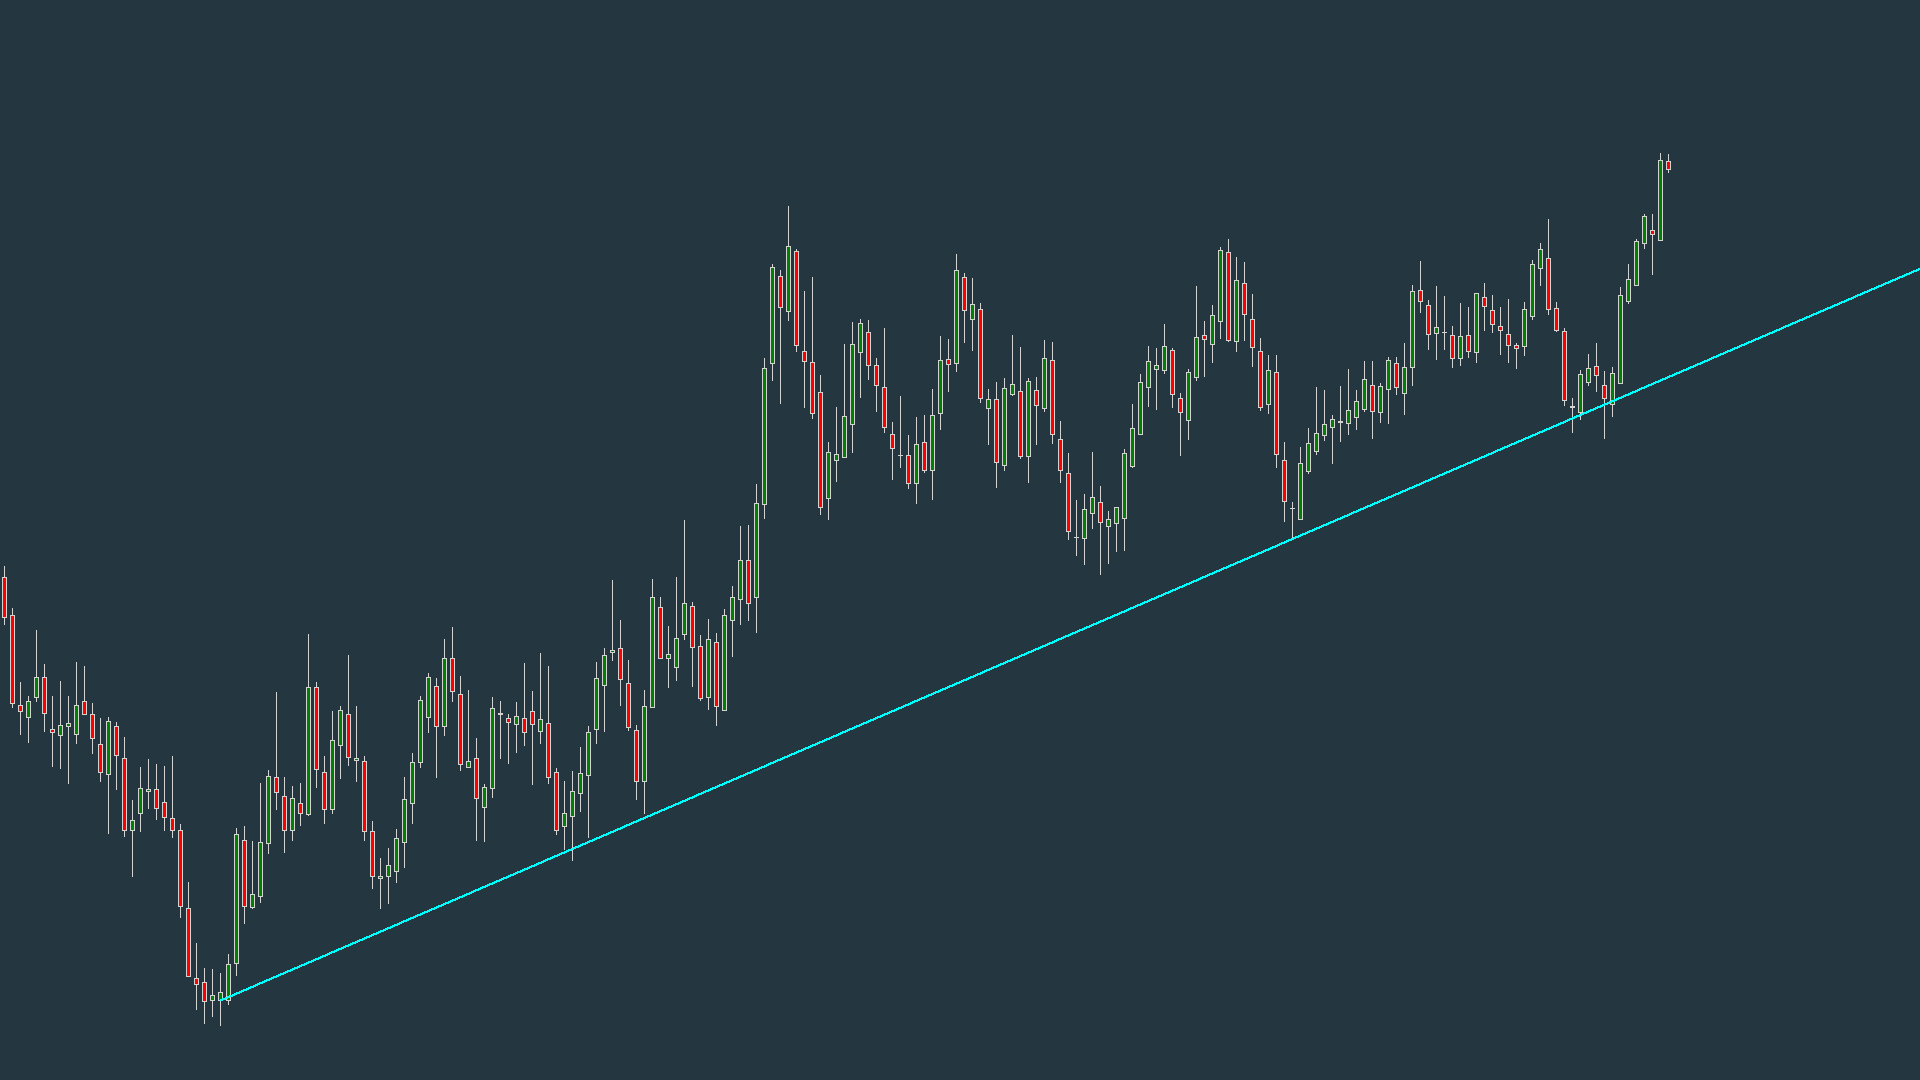
- Trend lines mapping higher highs and higher lows typically show the market is moving in a bullish trend.
- Trend lines mapping lower highs and lower lows typically show the market is moving in a bearish trend.
However, there are many different variations of trend lines, and they won’t always be mapping the outline of a trend.
Three Types of Trend Line
Trend lines can be broken down into three different types, based on their strength: baseline, standard, and micro.
1. Baseline Trend Lines
Baseline trend lines are the strongest of the three types. They map the outline of the structure structure and are rarely broken.
2. Standard Trend Lines
Standard trend lines are slightly weaker than baselines. They often map smaller price waves within a larger trend and may mix highs and lows, unlike baseline lines, which are more structured. These levels help see smaller trends within a bigger market move.

3. Micro Trend Lines
Micro trend lines are the weakest of the three, mapping tiny fluctuations within a wave rather than large, sweeping movements. These lines are based on very minor movements or shifts within a wave. If you zoomed in, you might notice that these smaller fluctuations are more noticeable at lower time frames.

Why Use Trend Lines?
There are a few benefits of using trend lines in your analysis:
- Help Identify the Market Direction: Trend lines (particularly baselines) can show the direction of the market trend, and the outline of that trend.
- Early Indicator of Changing Structure: If the price breaks through a trend line, it can be a sign the trend has weakened and may be about to change.
- Find Entry and Exit Points: Trend lines can be used to enter a trade, make trade management decisions, and exit a trade. We use trend lines with the Duomo Method, as when drawn correctly, they can be extremely accurate.
Learning How to Draw Trend Lines
Trend lines might seem straightforward, but getting them right is more complex than it sounds as there are many factors to take into account. We focus on precision, and getting the exact trajectory where we can pin point reversals.
If you want to learn how to draw them, check out our program which teaches how to identify, draw, and use trend lines effectively as part of a bigger trading strategy.